STANDARD DEVIATION
 STANDARD DEVIATION
The mathematics behind
a helpful risk
management tool
By Sarah Warhaftig, J.D., CRM
Isn’t that an oxymoron? How can something be both standard and a deviation?
When folks hear the word “deviation” they think of its societal definition “a noticed or arched departure from accepted norms of behavior.” Risk managers think of it differently—in terms of its mathematical application, “the amount by which a single measurement, observation or loss differs from a fixed value such as the mean.” Or simply, the standard deviation is a mathematical formula that measures the spread of numbers in a data set compared to the average of those numbers.
Risk managers use the standard deviation when analyzing a group of past losses to forecast future losses. Why do they do it? For budgeting and making financial decisions about coverage, deductibles and retentions and limits.
Once they have determined their anticipated losses, they can make informed choices about their insurance programs.
The array of losses must be a normal distribution for the process to be valid. What is a normal distribution? A normal distribution is symmetric about the mean, showing that data near the mean are more frequent in occurrence than data far from the mean.
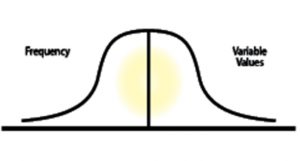
In a normal distribution, often called a bell curve because its shape resembles a symmetrical bell, the mean (average), median (middle value) and mode (most often) have the same value at the high point in the center.
But looking at a normal distribution, the question is: Is there an adequate amount of data to do the analysis?
Another issue facing the risk manager is the question of having enough data to have some degree of credibility in projections or other statistical measures. The Central Limit Theorem states that with an appropriately large sample, commonly 30 or more values per year for five consecutive years, that sample’s average can be treated as if it were drawn from a normal distribution.
The significance of a standard deviation in a normal distribution is that the mean can be readily and confidently be used to forecast losses.
What do we mean by “confidently?”
The Empirical Rule states that nearly all values lie within three standard deviations (SD) of the mean for a normal distribution to forecast final outcomes. The following sets of minimums and maximums (see chart below) are called Confidence Intervals:
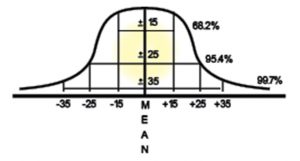
- 2% of values lie within 1 standard deviation of the mean 95.4% of values lie within 2 standard deviations of the mean
- 7% of values lie within 3 standard deviations of the mean
Confused? Let’s look at an example.
Alex is the risk manager for a pack-age delivery service. His auto losses for the past five years have been 175, 200, 185, 210, and 200. The CEO asks Alex how many losses are expected next year. Alex knows that the standard deviation (SD) is 15. (We’ll show you how to solve for this later in this column.) Alex can, with a 95% confidence level, provide the CEO with a range of losses.
First, calculate the mean: 175 + 200 + 185 + 210 + 200 = 970/5 = 194
Apply the confidence intervals to determine the range of losses (reference the chart above). The confidence level is 95%, which is +/- 2SD from the mean. The SD is 15, so 2(15) = 30
For the high number of losses, add the mean and 2SD: 194 + 30 = 224
For the low number of losses, sub-tract 2SD from the mean: 194 – 30 = 164
Alex will report that losses will range between 164 and 224.
Once we have the mean, we can then forecast future losses with degrees of confidence by applying the standard deviation to the mean.
Where does the standard deviation come from?
Remember, the standard deviation is a mathematical formula that measures the spread of numbers in a data set compared to the average of those numbers.
The official mathematical formula is:
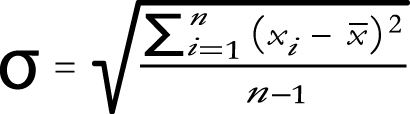
Let’s practice solving the standard deviation using the following array of losses: 1, 4, 2, 1, 1, 7, 5.
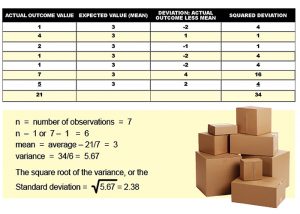
Calculate the standard deviation by following these steps (reference the chart and data below):
- Calculate the mean of the observations/losses: (see first column). Add the numbers in the first column and then divide by the number of observations in that column. So, 21/7=3, which becomes the expected value in the second column.
- Calculate the difference between each individual observation (first column) and the mean to arrive at the “deviation” from the mean: (see third column). Going across, subtract the number in the second column from the number in the first column.
- Square each of the deviations: (see column four). Multiply each number in the third column by itself (e.g., -2 x -2= 4).
- Sum the squared deviations (see bottom of fourth column).
- Divide the sum of the squared deviations by n-1, this is the variance (see below data).
- Take the square root of the variance resulting in the standard deviation
But wait! Here’s a professional tip: No one manually calculates this way anymore. The standard deviation can easily be calculated using the STDEV.P function in Excel. Thank goodness!
As you can see, the standard deviation is a valuable tool that risk managers can use to forecast future losses when they have sufficient loss data that comprises a normal distribution. By calculating the expected range of losses, they can make informed and well-reasoned decisions regarding their insurance programs and to determine which risk control initiatives are in order.
The author
Sarah Warhaftig, JD, CRM, is the aca-demic director of risk management programs for The National Alliance, where she is responsible for the CertifiedRisk Manager, Certified Personal Risk Manager and Certified School Risk Manager designation programs. She is a graduate of Tulane University and of Rutgers Law School.